Heads up! This blog post hasn't been updated in over 2 years. CodePen is an ever changing place, so if this post references features, you're probably better off checking the docs. Get in touch with support if you have further questions.
You’ll notice a couple of new buttons in the settings panels of each of the three editors.
Analyzing HTML
Here’s the HTML settings panel:

There is an “Analyze HTML” button down there now. You might guess what happens when you click it. It analyzes your HTML! The analysis is provided by HTML Inspector, a project by Philip Walton.
If it finds issues, we will display them inside the editor right at the top:

We run HTML Inspector with all the default rules turned on. We can fine-tune that over time if y’all have suggestions or come up with new awesome rules. We already have some ideas for improvements, including removing redundant messages and running it within the context of the preview iframe so it can analyze if you used your classes/IDs in the CSS or not as well.
Unfortunately HTML Inspector can’t show you the line number the error came from as it analyzes the HTML once it’s in the DOM, not the written markup itself. Also note this is a different thing than validating HTML. For instance it doesn’t catch unclosed tags and such.
Analyzing CSS
The “Analyze CSS” button is in the same position in the CSS settings panel as the “Analyze HTML” button is in the HTML settings panel.
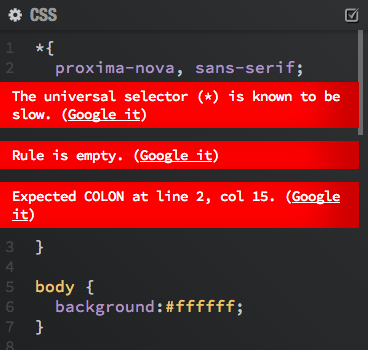
CSS analysis is provided by CSS Lint, a project by Nicole Sullivan and Nicholas C. Zakas. We have all the default rules turned on.
Click the button, get warning messages shown inline in the editor. CSS Lint analyzes your code itself so we are able to display the messages next to the appropriate line.

Analyzing JS
We’ve actually had JS Hint as a feature in CodePen for quite a while. In order to make it more consistent with these new Analyze features, we moved it to a button in the JS settings panel in the same place as the others. That also means we removed the keyboard command for it, which we’re going to re-use for clearing errors (more on that later).
JS analysis is provided by JS Hint, a project by Anton Kovalyov. Again, all default rules left on.
Click the button, get warning messages shown inline in the editor. JS Hint analyzes the written JavaScript itself, so again we can show errors right next to the line of code that triggered the warning.

Using a Preprocessor? No Problem!
As far as we know, there is no tool to analyze preprocessor code. You know, like actual Haml or Sass or CoffeeScript code or whatever.
Instead what we do is compile the code first (preprocess it) and then analyze the result. When you are working with a preprocessor, you don’t want to be editing the processed output, so we flip the editor into a read-only compiled-preview mode, and show you the errors there. That way we can match up real line numbers as well, which we can’t do otherwise.

This works for any of the preprocessors in any of the editors.
Clearing Errors
If you’ve run an analysis and it found and displayed errors, you will now see a new button in that editor’s settings panel that allows you to clear the errors.

You can click that to remove all the errors. We leave them in place until you do that so you can reference them as you fix stuff.
Another, perhaps even quicker way to remove them is to press Command-Shift-8 on Mac or Control-Shift-8 on PC.
As always, we’d love your feedback on this or any other feature of CodePen.